|
| 公司名称:苏州莱格玛电子有限公司 |
| 企业网址:www.laigem.com |
公司地址:苏州市平江区城北街道
金星工业小区内 |
| 联系电话:0512-61135696 |
|
 |
|
|
|
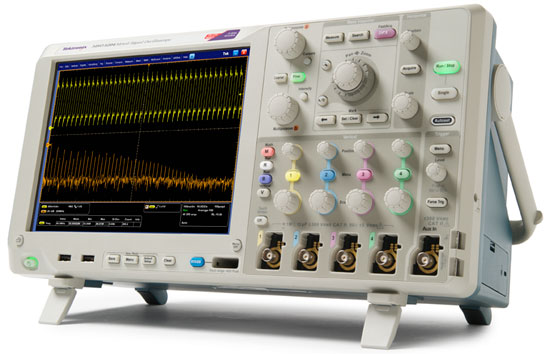
MSO/DPO5000
混合信号示波器系列
加快调试的每一个阶段!高端的性能,开放式的平台
MSO/DPO5000混合信号示波器系列拥有高达2 GHz的带宽和10 GS/s的采样率,提供了经济而又功能强大的基于Windows®的示波器。它提供了十几种不同的应用软件,您可以使用一台仪器测试多种不同的应用。泰克独有的功能如Fast Acq®和DPX®技术及杰出的触发套件,可以迅速发现其它示波器漏掉的间歇性事件。再加上完善的分析工具和创新的Wave Inspector®控制功能,MSO/DPO5000系列为您简化和加快复杂设计调试提供了所需的多功能工具。
MSO/DPO5000系列中的型号:
Features & Benefits
Key Performance Specifications
- 2 GHz, 1 GHz, 500 MHz, and 350 MHz Bandwidth Models
- Up to 10 GS/s Real-time Sample Rate on One or Two Channels and up to 5 GS/s on All Four Channels
- Up to 250 Megapoint Record Length with MultiView Zoom™
- >250,000 wfms/s Maximum Waveform Capture Rate with FastAcq™
- FastFrame Segmented Memory Acquisition Mode with >310,000 Frames per Second Capture Rate
- Standard Passive Voltage Probes with Less than 4 pF Capacitive Loading and 500 MHz or 1 GHz Analog Bandwidth
- 16 Digital Channels (MSO Series)
- User-selectable Bandwidth Limit Filters for Better Low-frequency Measurement Accuracy
- Suite of Advanced Triggers
Ease-of-Use Features
- Wave Inspector® Controls provide Easy Navigation and Automated Search of Waveform Data
- MyScope® Custom Control Windows and Right Mouse Click Menus for Exceptional Efficiency
- 53 Automated Measurements, Waveform Histograms, and FFT Analysis for Simplified Waveform Analysis
- TekVPI® Probe Interface supports Active, Differential, and Current Probes for Automatic Scaling and Units
- 10.4 in. (264 mm) Bright XGA Display with Touch Screen
- Small Footprint and Lightweight – Only 8.12 in. (206 mm) Deep and Less than 15 lb. (6.7 kg)
Connectivity
- Two USB Host Ports on the Front Panel and Four on the Rear Panel for Quick and Easy Data Storage, Printing, and Connecting USB Peripherals
- USB Device Port on the Rear Panel for Easy Connection to a PC or GPIB Control with an Adapter
- Integrated 10/100/1000BASE-T Ethernet Port for Network Connection and Video Out Port to Export the Oscilloscope Display to a Monitor or Projector
- Microsoft® Windows 7 64-bit Operating System for Easy Connectivity and Integration into Your Environment
- LXI Class C Compliant
Mixed Signal Design and Analysis (MSO Series)
- Automated Triggering and Decode on Parallel Buses
- Per-channel Threshold Settings
- MagniVu™ High-speed Acquisition provides 60.6 ps Fine Timing Resolution on Digital Channels
Optional Serial Triggering and Analysis
- Automated Serial Triggering and Decode Options for I2C, SPI, RS-232/422/485/UART, and USB
- Automated Serial Decode and Vehicle Network Monitoring of CAN and LIN
Optional Technology Specific Analysis
- Software Solutions provide Built-in Domain Expertise for Ethernet and USB 2.0 Compliance Testing, Jitter, Timing, Eye Diagrams, Power, and DDR Memory Bus Analysis
- Limit and Mask Testing provide Quick Insight into Signal Characteristics
Feature-rich Tools for Debugging Mixed Signal Designs
With the MSO/DPO5000 Mixed Signal Oscilloscope Series, you can analyze up to 20 analog and digital signals with a single instrument to quickly find and diagnose problems in complex designs. Bandwidths up to 2 GHz and sample rates up to 10 GS/s ensure you have the performance you need to see fast-changing signal details. To capture long windows of signal activity while maintaining fine timing resolution, the MSO/DPO5000 Series offers a deep record length of up to 12.5M points standard on all channels and an optional record length of up to 250M points on two channels.
With Wave Inspector® controls for rapid waveform navigation, and more than 10 optional software and analysis packages for common technologies and in-depth analysis tasks, the MSO/DPO5000 Series from Tektronix provides the feature-rich tools you need to simplify and speed debug of your complex design.
Comprehensive Features Speed Every Stage of Debug
The MSO/DPO5000 Series offers a robust set of features to speed every stage of debugging your design – from quickly discovering an anomaly and capturing it, to searching your waveform record for the event and analyzing its characteristics and your devices behavior.
Discover Discover – Fast waveform capture rate - over 250,000 wfm/s - maximizes the probability of capturing elusive glitches and other infrequent events. Discover – Fast waveform capture rate - over 250,000 wfm/s - maximizes the probability of capturing elusive glitches and other infrequent events.
To debug a design problem, first you must know it exists. Every design engineer spends time looking for problems in their design, a time-consuming and frustrating task without the right debug tools.
The MSO/DPO5000 Series offers the industrys most complete visualization of signals, providing fast insight into the real operation of your device. Tektronix proprietary FastAcq™ technology delivers a fast waveform capture – greater than 250,000 waveforms per second – that enables you to see glitches and other infrequent transients within seconds, revealing the true nature of device faults. A digital phosphor display with color intensity grading shows the history of a signals activity by using color to identify areas of the signal that occur more frequently, providing a visual display of just how often anomalies occur.
Capture Capture – Triggering on a specific transmit data packet going across an RS-232 bus. A complete set of triggers, including triggers for specific serial packet content, ensures you quickly capture your event of interest. Capture – Triggering on a specific transmit data packet going across an RS-232 bus. A complete set of triggers, including triggers for specific serial packet content, ensures you quickly capture your event of interest.
Discovering a device fault is only the first step. Next, you must capture the event of interest to identify root cause.
Accurately capturing any signal of interest begins with proper probing. The MSO/DPO5000 Series includes four high-impedance low-capacitance probes for accurate signal capture. These industry-first high-impedance passive voltage probes have less than 4 pF of capacitive loading to minimize the effect of the probe on your circuits operation, offering the performance of an active probe with the flexibility of a passive probe.
The MSO/DPO5000 Series provides a complete set of triggers – including runt, glitch, width, timeout, transition, pattern, state, setup/hold violation, serial packet, and parallel data – to help quickly find your event. Enhanced Triggering reduces trigger jitter at the trigger point. In this mode, the trigger point can be used as a measurement reference.
With up to a 250M point record length, you can capture many events of interest, even thousands of serial packets, in a single acquisition for further analysis while maintaining high resolution to zoom in on fine signal details. Investigate multiple segments of your waveform capture simultaneously with MultiView Zoom™ to quickly compare events in real time. FastFrame™ Segmented Memory mode enables you to make efficient use of large records by capturing many trigger events in a single record eliminating large time gaps between events of interest. View and measure the segments individually or as an overlay.
From triggering on specific packet content to automatic decode in multiple data formats, the MSO/DPO5000 Series provides integrated support for a broad range of serial buses – I2C, SPI, RS-232/422/485/UART, and USB. The ability to decode up to 16 serial and/or parallel buses simultaneously means you gain insight into system-level problems quickly.
To further help troubleshoot system-level interactions in complex embedded systems, the MSO5000 Series offers 16 digital channels in addition to its analog channels. Since the digital channels are fully integrated into the oscilloscope, you can trigger across all input channels, automatically time correlating all analog, digital, and serial signals. The MagniVu™ high-speed acquisition enables you to acquire fine signal detail (up to 60.6 ps resolution) around the trigger point for precision measurements. MagniVu is essential for making accurate timing measurements for setup and hold, clock delay, signal skew, and glitch characterization.
Search Search – Results of an advanced search for a runt pulse within a long waveform record. Each instance of the runt is automatically marked for easy reference. Wave Inspector controls provide unprecedented efficiency in viewing and navigating waveform data. Search – Results of an advanced search for a runt pulse within a long waveform record. Each instance of the runt is automatically marked for easy reference. Wave Inspector controls provide unprecedented efficiency in viewing and navigating waveform data.
Finding your event of interest in a long waveform record can be time consuming without the right search tools. With todays record lengths pushing beyond a million data points, locating your event can mean scrolling through thousands of screens of signal activity.
The MSO/DPO5000 Series offers the industrys most comprehensive search and waveform navigation with its innovative Wave Inspector® controls. These controls speed panning and zooming through your record. With a unique force-feedback system, you can move from one end of your record to the other in just seconds. User marks allow you to mark any location that you may want to reference later for further investigation. Or, automatically search your record for criteria you define. Wave Inspector will instantly search your entire record, including analog and digital data. Along the way it will automatically mark every occurrence of your defined event so you can quickly move between events. The advanced search and mark capability of the MSO/DPO5000 Series can even search for up to eight different events simultaneously and stop a live acquisition when it finds an event of interest, saving even more time.
Analyze Analyze – Waveform histogram of a falling edge showing the distribution of edge position (jitter) over time. Included are numeric measurements made on the waveform histogram data. A comprehensive set of integrated analysis tools speeds verification of your designs performance. Analyze – Waveform histogram of a falling edge showing the distribution of edge position (jitter) over time. Included are numeric measurements made on the waveform histogram data. A comprehensive set of integrated analysis tools speeds verification of your designs performance.
Verifying that your prototypes performance matches simulations and meets the projects design goals requires analyzing its behavior. Tasks can range from simple checks of rise times and pulse widths to sophisticated power loss analysis, characterization of system clocks, and investigation of noise sources. The MSO/DPO5000 Series offers a comprehensive set of integrated analysis tools including waveform- and screen-based cursors, 53 automated measurements, advanced waveform math including arbitrary equation editing, waveform histograms, and FFT analysis.
Every MSO/DPO5000 Series oscilloscope includes the DPOJET Essentials jitter and eye pattern analysis software package, extending the oscilloscopes measurement capabilities to make measurements over contiguous clock and data cycles in a single-shot real-time acquisition. This enables measurement of key jitter and timing analysis parameters such as Time Interval Error and Phase Noise to help characterize possible system timing issues. Analysis tools such as plots for time trends and histograms quickly show how timing parameters change over time, and spectrum analysis quickly shows the precise frequency and amplitude of jitter and modulation sources.
Specialized application support for serial bus debug and compliance test, jitter and eye pattern analysis, power supply design, limit/mask testing, and DDR memory bus analysis is also available.
Wave Inspector® Navigation and Advanced Search and Mark Wave Inspector controls provide unprecedented efficiency in viewing, navigating, and analyzing waveform data. Zip through your long record by turning the outer pan control (1). Get from the beginning to end in seconds. See something of interest and want to see more details? Just turn the inner zoom control (2). Wave Inspector controls provide unprecedented efficiency in viewing, navigating, and analyzing waveform data. Zip through your long record by turning the outer pan control (1). Get from the beginning to end in seconds. See something of interest and want to see more details? Just turn the inner zoom control (2).
A 12.5M point standard record length represents thousands of screens of information. The MSO/DPO5000 Series enables you to find your event in seconds with Wave Inspector, the industrys best tool for navigation and search.
Wave Inspector offers the following innovative controls:
Zoom/Pan
A dedicated, two-tier front-panel control provides intuitive control of both zooming and panning. The inner control adjusts the zoom factor (or zoom scale); turning it clockwise activates zoom and goes to progressively higher zoom factors, while turning it counterclockwise results in lower zoom factors and eventually turns zoom off. No longer do you need to navigate through multiple menus to adjust your zoom view. The outer control pans the zoom box across the waveform to quickly get to the portion you are interested in. The outer control also utilizes force feedback to determine how fast to pan on the waveform. The farther you turn the outer control, the faster the zoom box moves. Pan direction is changed by simply turning the control the other way.
Play/Pause Search step 1: You define what you would like to find. Search step 1: You define what you would like to find.  Search step 2: Wave Inspector automatically searches through the record and marks each event with a solid colored triangle. You can then use the Previous and Next buttons to jump from one event to the next. Search step 2: Wave Inspector automatically searches through the record and marks each event with a solid colored triangle. You can then use the Previous and Next buttons to jump from one event to the next.
A dedicated Play/Pause front-panel button scrolls the waveform across the display automatically while you look for anomalies or an event of interest. Playback speed and direction are controlled using the intuitive pan control. Once again, turning the control further makes the waveform scroll faster and changing direction is as simple as turning the control the other way.
User Marks
Press the Set Mark front-panel button to place one or more marks on the waveform. Navigating between marks is as simple as pressing the Previous (←) and Next (→) buttons on the front panel.
Search Marks
The Search button allows you to automatically search through your long acquisition looking for user-defined events. All occurrences of the event are highlighted with search marks and are easily navigated to, using the front-panel Previous (←) and Next (→) buttons. Search types include edge, glitch, width, timeout, runt, pattern, state, setup and hold, transition, and window.
Digital Phosphor Technology Digital phosphor technology enables greater than 250,000 wfm/s waveform capture rate and real-time color grading on the MSO/DPO5000 Series. Digital phosphor technology enables greater than 250,000 wfm/s waveform capture rate and real-time color grading on the MSO/DPO5000 Series.
The MSO/DPO5000 Series digital phosphor technology provides you with fast insight into the real operation of your device. Its fast waveform capture rate – greater than 250,000 wfm/s – gives you a high probability of quickly seeing the infrequent problems common in digital systems: runt pulses, glitches, timing issues, and more.
Waveforms are superimposed with one another and waveform points are color coded by frequency of occurrence. This quickly highlights the events that occur more often over time or, in the case of infrequent anomalies, occur less often.
With the MSO/DPO5000 Series, you can choose infinite persistence or variable persistence, determining how long the previous waveform acquisitions stay on-screen. This allows you to determine how often an anomaly is occurring.
Accurate High-speed Probing
The TPP Series probes, included standard with every MSO/DPO5000 Series oscilloscope, provide up to 1 GHz of analog bandwidth, and less than 4 pF of capacitive loading. The extremely low-capacitive loading minimizes adverse affects on your circuits and is more forgiving of longer ground leads. And with the probes wide bandwidth, you can see the high-frequency components in your signal, which is critical for high-speed applications. The TPP Series passive voltage probes offer all the benefits of general-purpose probes like high dynamic range, flexible connection options, and robust mechanical design, while providing the performance of active probes.
Mixed Signal Design and Analysis(MSO Series)
The MSO5000 Series mixed-signal oscilloscopes provide 16 digital channels. These channels are tightly integrated into the oscilloscopes user interface, simplifying operation and making it possible to solve mixed-signal issues easily.
Color-coded Digital Waveform Display With the color-coded digital waveform display, low values are shown in blue and high values are shown in green, enabling instant understanding of the bus value whether transitions are visible or not. You can set threshold values for each channel, enabling support for up to 16 different logic families. With the color-coded digital waveform display, low values are shown in blue and high values are shown in green, enabling instant understanding of the bus value whether transitions are visible or not. You can set threshold values for each channel, enabling support for up to 16 different logic families.
The MSO5000 Series has redefined the way you view digital waveforms. One common problem with other mixed-signal oscilloscopes is determining if data is a one or a zero when zoomed in far enough that the digital trace stays flat all the way across the display. To avoid this problem, the MSO5000 Series has color-coded digital traces, displaying ones in green and zeros in blue.
The multiple transition detection hardware of the MSO5000 Series will show you when the system detects more than one transition. This indicates that more information is available by zooming in or acquiring at faster sampling rates. In most cases zooming in will reveal a glitch that was not viewable with the previous settings.
MagniVu™ High-speed Acquisition The MagniVu high-resolution record provides 60.6 ps timing resolution, enabling you to make critical timing measurements on your digital waveforms. The MagniVu high-resolution record provides 60.6 ps timing resolution, enabling you to make critical timing measurements on your digital waveforms.
The main digital acquisition mode on the MSO5000 Series will capture up to 40M points at 500 MS/s (2 ns resolution). In addition to the main record, the MSO5000 provides an ultra high-resolution record called MagniVu which acquires 10,000 points at up to 16.5 GS/s (60.6 ps resolution). Both the main and MagniVu waveforms are acquired on every trigger and can be switched between on the display at any time, running or stopped. MagniVu provides significantly finer timing resolution than comparable mixed-signal oscilloscopes on the market, instilling confidence when making critical timing measurements on digital waveforms.
P6616 MSO Probe The P6616 MSO probe offers two eight-channel pods to simplify connecting to your device. The P6616 MSO probe offers two eight-channel pods to simplify connecting to your device.
This unique probe design offers two eight-channel pods. Each channel ends with a probe tip featuring a recessed ground for simplified connection to the device under test. The coax on the first channel of each pod is colored blue making it easy to identify. The common ground uses an automotive-style connector making it easy to create custom grounds for connecting to your device. When connecting to square pins, the P6616 has an adapter that attaches to the probe head, extending the probe ground flush with the probe tip so you can attach to a header. The P6616 offers outstanding electrical characteristics, having only 3 pF of capacitive loading, a 100 kΩ input resistance, and capable of acquiring toggle rates as fast as 500 MHz and pulses as short as 1 ns in duration.
Serial Triggering and Analysis (Optional) Triggering on a specific OUT Token packet on a USB full-speed serial bus. A bus waveform provides decoded packet content including Start, Sync, PID, Address, End Point, CRC, Data values, and Stop. Triggering on a specific OUT Token packet on a USB full-speed serial bus. A bus waveform provides decoded packet content including Start, Sync, PID, Address, End Point, CRC, Data values, and Stop.
On a serial bus, a single signal often includes address, control, data, and clock information. This can make isolating events of interest difficult. The MSO/DPO5000 Series offers a robust set of tools for debugging serial buses with automatic trigger and decode on I2C, SPI, RS-232/422/485/UART, and USB serial buses.
Serial Triggering
Trigger on packet content such as start of packet, specific addresses, specific data content, unique identifiers, etc. on popular serial interfaces such as I2C, SPI, RS-232/422/485/UART, and USB.
Bus Display
Provides a higher-level, combined view of the individual signals (clock, data, chip enable, etc.) that make up your bus, making it easy to identify where packets begin and end and identifying subpacket components such as address, data, identifier, CRC, etc.
Bus Decoding
Tired of having to visually inspect the waveform to count clocks, determine if each bit is a 1 or a 0, combine bits into bytes, and determine the hex value? Let the oscilloscope do it for you! Once youve set up a bus, the MSO/DPO5000 Series will decode each packet on the bus, and display the value in hex, binary, decimal (USB only) or ASCII (USB and RS-232/422/485/UART only) in the bus waveform.
CAN and LIN Timing and Protocol Decode Software (Optional) CAN and LIN Timing and Protocol Decode. CAN and LIN Timing and Protocol Decode.
The optional CAN/LIN serial analysis software package (Option VNM) enables you to ensure seamless and reliable operation of a CAN or LIN network. The software measures oscillator tolerance and propagation delay on CAN buses, and simultaneously decodes CAN and LIN messages.
Serial Bus Compliance Test (Optional) USB 2.0 Compliance Testing. USB 2.0 Compliance Testing.
Software packages for automated compliance test are available for Ethernet 10BASE-T and 100BASE-T (Option ET3), and USB 2.0 (Option USB) physical-layer devices. These software packages enable you to conduct testing using the standards specified compliance tests.
Power Analysis (Optional) Safe Operating Area measurement. Automated power measurements enable quick and accurate analysis of common power parameters. Safe Operating Area measurement. Automated power measurements enable quick and accurate analysis of common power parameters.
The optional power analysis software package (Option PWR) enables quick and accurate analysis of power quality, switching loss, harmonics, magnetic measurements, safe operating area (SOA), modulation, ripple, and slew rate (di/dt, dv/dt). Automated, repeatable power measurements are available with a touch of a button; no external PC or complex software setup is required. The package includes a report generation tool to create customizable, detailed reports to document your measurement results.
Advanced Analysis, Jitter, Timing, and Eye Diagram Measurements (Optional) Advanced Analysis, Jitter, Eye Diagram, and Timing measurements. Advanced Analysis, Jitter, Eye Diagram, and Timing measurements.
The optional DPOJET Advanced software package (Option DJA) offers extended capabilities, providing a complete suite of analysis tools for insight into jitter and timing as well as other signal quality issues. DPOJET Advanced adds advanced tools such as Rj/Dj separation, eye diagram masks, and Pass/Fail limits for conformance testing. The innovative one-touch wizard makes setup for jitter measurements easy. DPOJET Advanced is also a measurement framework that works in conjunction with standards-specific compliance test packages for applications such as DDR memory and USB.
Limit/Mask Testing (Optional) Mask testing an OC-12 signal, capturing any violations of the mask. Mask testing an OC-12 signal, capturing any violations of the mask.
The optional limit test (Option LT) and mask test (Option MTM) software packages are useful for long-term signal monitoring, characterizing signals during design, and testing on a production line. The limit test software compares a tested signal to a known good or "golden" version of the same signal with user-defined vertical and horizontal tolerances. The mask test software includes a robust set of masks for telecommunications and computer standards for easily checking compliance to a standard. Additionally, custom masks can be created and used for characterizing signals. With both software packages you can tailor a test to your specific requirements by defining test duration in a number of waveforms, setting a violation threshold that must be met before considering a test a failure, counting hits along with statistical information, and setting actions upon violations, test failure, and test complete. Whether specifying a limit template or a mask, conducting pass/fail tests in search of waveform anomalies such as glitches has never been easier.
DDR Memory Bus Analysis (Optional)
The optional DDR memory analysis software package (Option DDRA) automatically identifies DDR1, DDR2, LP-DDR1, and LP-DDR2 Reads and Writes and makes JEDEC conformance measurements with Pass/Fail results on all edges in every Read and Write burst, perfect for debugging and troubleshooting DDR memory buses. Also provided are common measurements of clock, address, and control signals. Used in conjunction with DPOJET (Option DJA), Option DDRA is the fastest way to debug complex memory signaling issues.
Designed to Make Your Work Easier
Large, High-resolution Display
The MSO/DPO5000 Series features a 10.4 in. (264 mm) XGA color display with an integrated touch screen for seeing intricate signal details.
Dedicated Front-panel Controls
Per-channel vertical controls provide simple and intuitive operation. No longer do you need to share one set of vertical controls across all four channels.
Connectivity
Two USB host ports on the front panel enable easy transfer of screenshots, instrument settings, and waveform data to a USB thumb drive. The rear panel contains four additional USB host ports and a USB device port for controlling the oscilloscope remotely from a PC or for connecting USB peripherals. An integrated 10/100/1000BASE-T Ethernet port enables easy connection to networks and a Video Out port allows the oscilloscope display to be exported to an external monitor or projector. PS-2 ports for keyboard and mouse are included for security-conscious applications that require the USB ports to be disabled. A standard removable hard disk drive makes customizing settings for different users easy as well as enables use in secure environments.
Compact Form Factor The MSO/DPO5000 Series compact form factor frees up valuable space on your bench. The MSO/DPO5000 Series compact form factor frees up valuable space on your bench.
A compact, portable form factor allows the MSO/DPO5000 Series to be easily moved between labs and, with a depth of just 8.12 in. (206 mm), it saves you valuable space on your test bench. Additionally the 5U rack height makes the MSO/DPO5000 Series an ideal choice for ATE applications where rack space is limited.
TekVPI® Probe Interface TekVPI probe interface simplifies connecting your probes to the oscilloscope. TekVPI probe interface simplifies connecting your probes to the oscilloscope.
The TekVPI probe interface sets the standard for ease of use in probing. TekVPI probes feature status indicators and controls, as well as a probe menu button right on the probe itself. This button brings up a probe menu on the oscilloscope display with all relevant settings and controls for the probe. The TekVPI interface enables direct attachment of a current probe without requiring a separate power supply. TekVPI probes can be controlled remotely through USB, GPIB, or Ethernet, enabling more versatile solutions in ATE environments.
MyScope® Custom Control Window MyScope custom control windows are created with a simple drag-and-drop process enabling each user to have a unique interface. MyScope custom control windows are created with a simple drag-and-drop process enabling each user to have a unique interface.
Easily create your own personalized "toolbox" of oscilloscope features in a matter of minutes using a simple, visual, drag-and-drop process. Once created, these custom control windows are easily accessed through a dedicated MyScope menu selection on the oscilloscope. This is ideal in a shared resource environment where each person can have their own custom control interface suited to their particular use. MyScope control windows benefit all oscilloscope users, eliminating the ramp-up time that many face when returning to the lab after not using an oscilloscope for a while, and enabling power users to be far more efficient.
Floating Licenses
Floating licenses offer an alternative method to manage your Tektronix asset. Floating licenses allow license-key enabled options to be easily moved among all your MSO/DPO5000, DPO7000, and DPO/DSA/MSO70000 Series of Tektronix oscilloscopes. Floating licenses are available for many license-key enabled options. To order a floating version of an option license add “DPOFL-“ prefix to the option name. (e.g. DPOFL-ET3)
Check www.tektronix.com for additional information about floating license options.
Remote Operation and Extended Analysis Capture data into Microsoft Excel using the unique Excel toolbar, and create custom reports using the Word toolbar. Capture data into Microsoft Excel using the unique Excel toolbar, and create custom reports using the Word toolbar.
There are many ways to connect to your MSO/DPO5000 Series oscilloscope to conduct extended analysis. The first makes use of the Windows Remote Desktop capability – connect directly to your oscilloscope and operate the user interface remotely through the built-in Remote Desktop. A second way to connect is through Tektronix OpenChoice® software which makes use of the fast embedded bus, transferring waveform data directly from acquisition to analysis applications on the Windows desktop at much faster speeds than conventional GPIB transfers. Industry-standard protocols, such as TekVISA™ interface and ActiveX controls are included for using and enhancing Windows applications for data analysis and documentation. IVI-COM instrument drivers are included to enable easy communication with the oscilloscope using GPIB, serial data, and LAN connections from programs running on the instrument or an external PC. Or, use the Software Developers Kit (SDK) to help create custom software to automate multistep processes in waveform collection and analysis with Visual BASIC, C, C++, MATLAB, LabVIEW, LabWindows/CVI, and other common Application Development Environments (ADE). Microsoft® Excel and Word toolbars are included to simplify data capture and transfer directly to these programs running on the Windows desktop. A third way to connect to your oscilloscope is through NI LabVIEW SignalExpress Tektronix Edition, enabling you to instantly acquire, generate, analyze, compare, import, and save measurement data and signals using an intuitive drag-and-drop user interface that does not require any programming.
Characteristics
Vertical System Analog Channels
|
Characteristic |
MSO5034
DPO5034 |
MSO5054
DPO5054 |
MSO5104
DPO5104 |
MSO5204
DPO5204 |
|
Input Channels |
4 |
|
Analog Bandwidth (–3 dB) |
350 MHz |
500 MHz |
1 GHz |
2 GHz |
|
Rise Time (Calculated) |
1 ns |
700 ps |
350 ps |
175 ps |
|
DC Gain Accuracy |
±1.5%, derated at 0.10%/°C above 30 °C |
|
Bandwidth Limits |
Depending on instrument model: 1 GHz, 500 MHz, 350 MHz, 250 MHz, and 20 MHz |
|
Input Coupling |
AC, DC |
|
Input Impedance |
1 MΩ ±1%, 50 Ω ±1% |
|
Input Sensitivity |
1 MΩ: 1 mV/div to 10 V/div
50 Ω: 1 mV/div to 1 V/div |
|
Vertical Resolution |
8 bits (11 bits with Hi Res) |
|
Max Input Voltage, 1 MΩ |
300 VRMS CAT II, with peaks ≤ ±425 V
For <100 mV/div derate at 20 dB/decade above 100 kHz to 30 VRMS at 1 MHz, 10 dB/decade above 1 MHz
For ≥100 mV/div derate at 20 dB/decade above 3 MHz to 30 VRMS at 30 MHz, 10 dB/decade above 30 MHz |
|
Max Input Voltage, 50 Ω |
5 VRMS, with peaks ≤ ±20 V |
|
Position Range |
±5 divisions |
|
Delay between any Two Channels (Typical) |
≤100 ps (50 Ω, DC coupling and equal V/div at or above 10 mV/div) |
|
Offset Range |
|
1 mV/div - 50 mV/div |
1 MΩ: ±1 V
50 Ω: ±1 V |
|
50.5 mV/div - 99.5 mV/div |
1 MΩ: ±0.5 V
50 Ω: ±0.5 V |
|
100 mV/div - 500 mV/div |
1 MΩ: ±10 V
50 Ω: ±10 V |
|
505 mV/div - 995 mV/div |
1 MΩ: ±5 V
50 Ω: ±5 V |
|
1 V/div - 5 V/div |
1 MΩ: ±100 V
50 Ω: ±5 V |
|
5.05 V/div - 10 V/div |
1 MΩ: ±50 V
50 Ω: NA |
|
Offset Accuracy |
±(0.005 × |offset – position| + DC Balance)
Note: Both position and constant offset term must be converted to volts by multiplying by the appropriate volts/div term |
|
Channel-to-Channel Isolation (Any two channels at equal Vertical Scale settings) (Typical) |
≥100:1 at ≤100 MHz and ≥30:1 at >100 MHz up to the rated BW |
Vertical System Digital Channels
|
Characteristic |
All MSO5000 Models |
|
Input Channels |
16 Digital (D15 - D0) |
|
Thresholds |
Per-channel Thresholds |
|
Threshold Selections |
TTL, ECL, User |
|
User-defined Threshold Range |
±40 V |
|
Threshold Accuracy |
±(100 mV + 3% of threshold setting) |
|
Maximum Input Voltage |
±42 Vpeak |
|
Input Dynamic Range |
30 Vp-p ≤200 MHz
10 Vp-p >200 MHz |
|
Minimum Voltage Swing |
400 mV |
|
Input Impedance |
100 kΩ |
|
Probe Loading |
3 pF |
|
Vertical Resolution |
1 bit |
Horizontal System Analog Channels
|
Characteristic |
MSO5034
DPO5034 |
MSO5054
DPO5054 |
MSO5104
DPO5104 |
MSO5204
DPO5204 |
|
Maximum Sample Rate (All channels) |
5 GS/s |
5 GS/s |
5 GS/s |
5 GS/s |
|
Maximum Sample Rate (1 or 2 channels) |
— |
— |
10 GS/s |
10 GS/s |
|
Maximum Equivalent Time Sampling Rate |
400 GS/s |
|
Maximum Record Length with Standard Configuration |
12.5M |
12.5M (4 ch)
25M (1 or 2 ch) |
|
Maximum Record Length with Option 2RL |
25M |
25M (4 ch)
50M (1 or 2 ch) |
|
Maximum Record Length with Option 5RL |
50M |
50M (4 ch)
125M (1 or 2 ch) |
|
Maximum Record Length with Option 10RL |
125M |
125M (4 ch)
250M (1 or 2 ch) |
|
Maximum Duration at Highest Real-Time Sample Rate |
25 ms |
|
Time Base Range |
250 ps/div to 1000 s/div |
|
Time Resolution (in ET/IT mode) |
2.5 ps/div |
|
Time Base Delay Time Range |
–5 divisions to 5000 s |
|
Channel-to-Channel Deskew Range |
±75 ns |
|
Trigger Jitter (RMS) |
≤10 psRMS for Edge trigger type
≤100 psRMS for all Non-edge trigger types |
|
Time Base Accuracy |
±5 ppm over any ≥1 ms interval |
Horizontal System Digital Channels
|
Characteristic |
All MSO5000 Models |
|
Maximum Sample Rate (Main) |
500 MS/s (2 ns resolution) |
|
Maximum Record Length (Main) |
12.5M Standard,
Up to 40M with Record Length options |
|
Maximum Sample Rate (MagniVu) |
16.5 GS/s (60.6 ps resolution) |
|
Maximum Record Length (MagniVu) |
10k points centered around the trigger |
|
Minimum Detectable Pulse Width |
1 ns |
|
Channel-to-Channel Skew (typical) |
200 ps |
|
Maximum Input Toggle Rate |
500 MHz at minimum input swing; higher toggle rates can be achieved at higher amplitudes |
Trigger System
|
Characteristic |
Description |
|
Main Trigger Modes |
Auto, Normal, and Single |
|
Trigger Coupling |
DC, AC, HF Rej (attenuates >50 kHz), LF Rej (attenuates <50 kHz), Noise Reject (reduces sensitivity) |
|
Trigger Holdoff Range |
250 ns to 8 s |
|
Trigger Sensitivity |
|
Internal DC Coupled |
For 1 MΩ:
1 mV/div to 4.98 mV/div: 0.75 div from DC to 50 MHz, increasing to 1.3 div at instrument bandwidth
≥5 mV/div: 0.40 div from DC to 50 MHz, increasing to 1 div at instrument bandwidth
For 50 Ω:
0.40 div from DC to 50 MHz, increasing to 1 div at instrument bandwidth |
|
External (Auxiliary Input) 1 MΩ |
200 mV from DC to 50 MHz, increasing to 500 mV at 250 MHz |
|
Trigger Level Range |
|
Any Channel |
±8 divisions from center of screen |
|
External (Auxiliary Input) |
±8 V |
|
Line |
Fixed at about 50% of line voltage |
Trigger Modes
|
Mode |
Description |
|
Edge |
Positive or negative slope on any channel or front-panel auxiliary input. Coupling includes DC, AC, HF reject, LF reject, and noise reject |
|
Glitch |
Trigger on or reject glitches of positive, negative, or either polarity. Programmable glitch width is 4 ns minimum to 8 s maximum |
|
Runt |
Trigger on a pulse that crosses one threshold but fails to cross a second threshold before crossing the first again |
|
Width |
Trigger on width of positive or negative pulse either within or outside of selectable limits (4 ns to 8 s) |
|
Timeout |
Trigger on an event which remains high, low, or either, for a specified time period (4 ns to 8 s) |
|
Transition |
Trigger on pulse edge rates that are faster or slower than specified. Slope may be positive, negative, or either |
|
Setup/Hold |
Trigger on violations of both setup time and hold time between clock and data present on any two input channels |
|
Pattern |
Trigger when any logical pattern of signals goes false or stays true for specified period of time (4 ns to 1 s). Pattern (AND, OR, NAND, NOR) specified for all analog and digital input channels defined as High, Low, or Dont Care |
|
State |
Any logical pattern of analog channels and digital channels (MSO models) clocked by edge on another channel. Trigger on rising or falling clock edge |
|
Video |
Trigger on all lines, specific line number, odd, even, or all fields on NTSC, PAL, SECAM, and HDTV 480p/60, 576p/50, 875i/60, 720p/30, 720p/50, 720p/60, 1080/24sF, 1080i/50, 1080p/25, 1080i/60, 1080p/24, 1080p/25, 1080p/50, 1080p/60, Bi-level, Tri-level |
|
Trigger Sequences |
Main, Delayed by Time, Delayed by Events. All sequences can include separate horizontal delay after the trigger event to position the acquisition window in time |
|
A/B Sequence Event Trigger Types |
Edge |
|
Trigger Delay by Time |
4 ns to 8 s |
|
Trigger Delay by Events |
1 to 4,000,000 events |
|
I2C (Optional) |
Trigger on Start, Repeated Start, Stop, Missing ACK, Address (7 or 10 bit), Data, or Address and Data on I2C buses up to 10 Mb/s |
|
SPI (Optional) |
Trigger on SS or data on SPI buses up to 10 Mb/s |
|
RS-232/422/485/UART (Optional) |
Trigger on Start Bit, End of Packet, Data, and Parity Error up to 10 Mb/s |
|
USB (Optional) |
Low-speed: Trigger on Sync, Reset, Suspend, Resume, End of Packet, Token (Address) Packet, Data Packet, Handshake Packet, Special Packet, Error.
Token Packet Trigger – Any token type, SOF, OUT, IN, SETUP; Address can be specified for Any, OUT, IN, and SETUP token types. Address can be further specified to trigger on ≤, <, =, >, ≥, != a particular value, or inside or outside of a range. Frame number can be specified for SOF token using Binary, Hex, Unsigned Decimal, and Dont Care digits.
Data Packet Trigger – Any data type, DATA0, DATA1; Data can be further specified to trigger on ≤, <, =, >, ≥, != a particular data value, or inside or outside of a range.
Handshake Packet Trigger – Any handshake type, ACK, NAK, STALL.
Special Packet Trigger – Any special type, Reserved.
Error Trigger – PID Check, CRC5 or CRC16, Bit Stuffing. |
|
Full-speed: Trigger on Sync, Reset, Suspend, Resume, End of Packet, Token (Address) Packet, Data Packet, Handshake Packet, Special Packet, Error.
Token Packet Trigger – Any token type, SOF, OUT, IN, SETUP; Address can be specified for Any, OUT, IN, and SETUP token types. Address can be further specified to trigger on ≤, <, =, >, ≥, != a particular value, or inside or outside of a range. Frame number can be specified for SOF token using Binary, Hex, Unsigned Decimal, and Dont Care digits.
Data Packet Trigger – Any data type, DATA0, DATA1; Data can be further specified to trigger on ≤, <, =, >, ≥, != a particular data value, or inside or outside of a range.
Handshake Packet Trigger – Any handshake type, ACK, NAK, STALL.
Special Packet Trigger – Any special type, PRE, Reserved.
Error Trigger – PID Check, CRC5 or CRC16, Bit Stuffing. |
|
High-speed: Trigger on Sync, Reset, Suspend, Resume, End of Packet, Token (Address) Packet, Data Packet, Handshake Packet, Special Packet, Error.
Token Packet Trigger – Any token type, SOF, OUT, IN, SETUP; Address can be specified for Any, OUT, IN, and SETUP token types. Address can be further specified to trigger on ≤, <, =, >, ≥, != a particular value, or inside or outside of a range. Frame number can be specified for SOF token using Binary, Hex, Unsigned Decimal, and Dont Care digits.
Data Packet Trigger – Any data type, DATA0, DATA1, DATA2, DATAM; Data can be further specified to trigger on ≤, <, =, >, ≥, != a particular data value, or inside our outside of a range.
Handshake Packet Trigger – Any handshake type, ACK, NAK, STALL, NYET.
Special Packet Trigger – Any special type, ERR, SPLIT, PING, Reserved. SPLIT packet components that can be specified include:
Hub Address
Start/Complete – Dont Care, Start (SSPLIT), Complete (CSPLIT)
Port Address
Start and End bits – Dont Care, Control/Bulk/Interrupt (Full-speed Device, Low-speed Device), Isochronous (Data is Middle, Data is End, Data is Start, Data is All)
Endpoint Type – Dont Care, Control, Isochronous, Bulk, Interrupt
Error Trigger – PID Check, CRC5, CRC16, Any. |
|
Note: High-speed support only available on 1 GHz and 2 GHz models. |
Trigger Characteristics
|
Characteristic |
Description |
|
Enhanced Triggering |
User-selectable; corrects the difference in timing between the trigger path and the acquired data (not available in FastAcq) |
Acquisition Modes
|
Mode |
Description |
|
Sample |
Acquire sampled values |
|
Peak Detect |
Captures narrow glitches as narrow as 100 ps (2 GHz and 1 GHz models) or 200 ps (500 MHz and 350 MHz models) at all real-time sampling rates |
|
Averaging |
From 2 to 10,000 waveforms included in average |
|
Envelope |
Min-Max envelope reflecting Peak Detect data over multiple acquisitions |
|
Hi Res |
Real-time boxcar averaging reduces random noise and increases resolution |
|
Roll |
Scrolls sequential waveform points across the display in a right-to-left rolling motion at sweep speeds slower than 50 ms/div. Up to 20 MS/s with a maximum record length of 10M |
|
FastAcq Acquisition Mode |
FastAcq optimizes the instrument for analysis of dynamic signals and capture of infrequent events |
|
Maximum FastAcq Waveform Capture Rate |
>250,000 wfms/s on all 4 channels simultaneously |
|
Waveform Database |
Accumulate waveform database providing three-dimensional array of amplitude, time, and counts |
|
FastFrame™ Acquisition |
Acquisition memory divided into segments; maximum trigger rate >310,000 waveforms per second. Time of arrival recorded with each event. Frame finder tool helps to visually identify transients |
Search and Mark Events
|
Characteristic |
Description |
|
Automated Search and Mark |
Automatically mark events and document waveforms. Search positive/negative slopes or both, glitches, runts, pulse widths, transition rate, setup and hold, timeout, windows, or find any logic or state pattern on any number of channels. Search DDR Read or Write bursts with Opt. DDRA. Event table summarizes all found events. All events are time stamped in reference to trigger position. Stop acquisitions when an event is found |
Waveform Measurements
|
Measurement |
Description |
|
Cursors |
Waveform and Screen |
|
Automatic Measurements |
53, of which 8 can be displayed on-screen at any one time. Measurements include: Period, Frequency, Delay, Rise Time, Fall Time, Positive Duty Cycle, Negative Duty Cycle, Positive Width, Negative Width, Burst Width, Phase, Positive Overshoot, Negative Overshoot, Peak-to-Peak, Amplitude, High, Low, Maximum, Minimum, Mean, Cycle Mean, RMS, Cycle RMS, Area, Cycle Area |
|
Eye-pattern Measurements |
Extinction Ratio (absolute, %, dB), Eye Height, Eye Width, Eye Top, Eye Base, Crossing %, Jitter (p-p, RMS, 6sigma), Noise (p-p, RMS), Signal/Noise Ratio, Cycle Distortion, Q-Factor |
|
Measurement Statistics |
Mean, Minimum, Maximum, Standard Deviation |
|
Reference Levels |
User-definable reference levels for automatic measurements can be specified in either percent or units |
|
Gating |
Isolate the specific occurrence within an acquisition to take measurements on, using either screen or waveform cursors |
|
Waveform Histogram |
A waveform histogram provides an array of data values representing the total number of hits inside of a user-defined region of the display. A waveform histogram is both a visual graph of the hit distribution as well as a numeric array of values that can be measured.
Sources – Channel 1, Channel 2, Channel 3, Channel 4, Ref 1, Ref 2, Ref 3, Ref 4, Math 1, Math 2, Math 3, Math 4
Types – Vertical, Horizontal |
|
Waveform Histogram Measurements |
Waveform Count, Hits in Box, Peak Hits, Median, Maximum, Minimum, Peak-to-Peak, Mean (μ), Standard Deviation (sigma), μ+1sigma, μ+2sigma, μ+3sigma |
Waveform Processing/Math
|
Characteristic |
Description |
|
Arithmetic |
Add, Subtract, Multiply, Divide waveforms and scalars |
|
Algebraic Expressions |
Define extensive algebraic expressions including waveforms, scalars, user-adjustable variables, and results of parametric measurements. Perform math on math using complex equations.
e.g. (Integral (CH1 – Mean(CH1)) × 1.414 × VAR1) |
|
Math Functions |
Average, Invert, Integrate, Differentiate, Square Root, Exponential, Log10, Log e, Abs, Ceiling, Floor, Min, Max, Sin, Cos, Tan, ASin, ACos, ATan, Sinh, Cosh, Tanh |
|
Relational |
Boolean result of comparison >, <, ≥, ≤, ==, != |
|
Frequency Domain Functions (FFT) |
Spectral Magnitude and Phase, Real and Imaginary Spectra |
|
FFT Vertical Units |
Magnitude: Linear, dB, dBm |
|
Phase: Degrees, radians, group delay |
|
IRE and mV units |
|
FFT Window Functions |
Rectangular, Hamming, Hanning, Kaiser-Bessel, Blackman-Harris, Gaussian, Flattop2, Tek Exponential |
|
Waveform Definition |
As an arbitrary math expression |
|
Filtering Functions |
User-definable filters. Users specify a filter containing the coefficients of the filter. Filter files provided |
|
Mask Function |
A function that generates a waveform database pixmap from a sample waveform. Sample count can be defined |
Software
|
Software |
Description |
|
NI LabVIEW SignalExpress Tektronix Edition |
A fully interactive measurement software environment optimized for the MSO/DPO5000 Series, enables you to instantly acquire, generate, analyze, compare, import, and save measurement data and signals using an intuitive drag-and-drop user interface that does not require any programming.
Standard MSO/DPO5000 Series support for acquiring, controlling, viewing, and exporting your live signal data is permanently available through the software. The full version (SIGEXPTE) adds additional signal processing, advanced analysis, mixed signal, sweeping, limit testing, and user-defined step capabilities and is available for a 30-day trial period standard with each instrument. |
|
IVI Driver |
Provides a standard instrument programming interface for common applications such as LabVIEW, LabWindows/CVI, Microsoft .NET and MATLAB. IVI-COM standard |
|
LXI Class C
Web Interface |
Connect to the MSO/DPO5000 Series through a standard web browser by simply entering the oscilloscopes IP address in the address bar of the browser. The web interface enables viewing of instrument status and configuration, as well as status and modification of network settings. All web interaction conforms to LXI Class C specification |
Display Characteristics
|
Characteristic |
Description |
|
Display Type |
Liquid-crystal active-matrix color display with touch screen |
|
Display Size |
Diagonal: 10.4 in. (264 mm) |
|
Display Resolution |
1024 horizontal × 768 vertical pixels (XGA) |
|
Waveform Styles |
Vectors, Dots, Variable Persistence, Infinite Persistence |
|
Color Palettes |
Normal, Green, Gray, Temperature, Spectral, and User Defined |
|
Display Format |
YT, XY |
Computer System and Peripherals
|
Characteristic |
Description |
|
Operating System |
Windows 7 Ultimate 64-bit |
|
CPU |
Intel Core 2 Duo, ≥2 GHz processor |
|
PC System Memory |
≥4 GB |
|
Hard Disk Drive |
Removable hard disk drive, ≥160 GB capacity (2.5 in. SATA) |
|
Mouse |
Optical wheel mouse, USB interface |
|
Keyboard |
Order 119-7083-xx for small keyboard; USB interface and hub |
Input/Output Ports
|
Port |
Description |
|
USB 2.0 High-speed Host Ports |
Supports USB mass storage devices, printers, keyboard, and mouse. Two ports on front and four ports on rear of instrument. Can be disabled individually |
|
USB 1.1 Full-speed Device Port |
Rear-panel connector allows for communication/control of oscilloscope through USBTMC or GPIB (with a TEK-USB-488 adapter) |
|
LAN Port |
RJ-45 connector, supports 10/100/1000BASE-T |
|
Video Out Port |
DB-15 female connector, connect to show the oscilloscope display on an external monitor or projector. Support for extended desktop and clone mode |
|
Audio Ports |
Miniature phono jacks |
|
Keyboard Port |
PS/2 compatible |
|
Mouse Port |
PS/2 compatible |
|
Auxiliary Input |
Front-panel BNC connector. Input impedance 1 MΩ. Max input 300 VRMS with peaks ≤ ±425 V |
|
Auxiliary Out
(Software switchable) |
Trigger Out: A TTL compatible pulse when the oscilloscope triggers
Time Base Reference Out: A TTL compatible output of internal 10 MHz reference oscillator |
|
External Reference In |
Time base system can phase lock to an external 10 MHz reference (10 MHz ±1%) |
|
Probe Compensator Output |
Front-panel pins
Amplitude: 2.5 V
Frequency: 1 kHz |
Lan eXtensions for Instrumentation (LXI)
|
Characteristic |
Description |
|
Class |
LXI Class C |
|
Version |
V1.3 |
Power Source
|
Characteristic |
Description |
|
Power Source Voltage |
100 to 240 V ±10% |
|
Power Source Frequency |
45 Hz to 66 Hz (85 to 264 V)
360 Hz to 440 Hz (100 to 132 V) |
|
Power Consumption |
275 W maximum |
Physical Characteristics
|
Dimension |
mm |
in. |
|
Height |
233 |
9.16 |
|
Width |
439 |
17.29 |
|
Depth |
206 |
8.12 |
|
Weight |
kg |
lb. |
|
Net |
6.7 |
14.9 |
|
Shipping |
12.5 |
27.5 |
|
Rackmount Configuration |
5U |
|
Cooling Clearance |
2 in. (51 mm) required on left side and rear of instrument |
Environmental
|
Characteristic |
Description |
|
Temperature |
|
Operating |
5 °C to +50 °C |
|
Nonoperating |
–20 °C to +60 °C |
|
Humidity |
|
Operating |
8% to 90% relative humidity with a maximum wet-bulb temperature of 29 °C at or below +50 °C (upper limit de-rates to 20.6% relative humidity at +50 °C). Noncondensing |
|
Nonoperating |
5% to 98% relative humidity with a maximum wet-bulb temperature of 40 °C at or below +60 °C (upper limit de-rates to 29.8% relative humidity at +60 °C). Noncondensing |
|
Altitude |
|
Operating |
9,843 ft. (3,000 m) |
|
Nonoperating |
30,000 ft. (9,144 m) |
|
Regulatory |
|
Electromagnetic compatibility |
2004/108/EC |
|
Certifications |
UL61010-1, Second Edition; CSA61010-1 Second Edition, EN61010-1:2001; IEC 61010-1:2001 |
Ordering Information
MSO/DPO5000 Family
|
Product |
Description |
|
DPO5000 Models |
|
DPO5034 |
350 MHz, 5 GS/s, 12.5M record length, 4-channel digital phosphor oscilloscope |
|
DPO5054 |
500 MHz, 5 GS/s, 12.5M record length, 4-channel digital phosphor oscilloscope |
|
DPO5104 |
1 GHz, 10/5 GS/s (2/4 ch), 12.5M record length, 4-channel digital phosphor oscilloscope |
|
DPO5204 |
2 GHz, 10/5 GS/s (2/4 ch), 12.5M record length, 4-channel digital phosphor oscilloscope |
|
MSO5000 Models |
|
MSO5034 |
350 MHz, 5 GS/s, 12.5M record length, 4+16 channel mixed signal oscilloscope |
|
MSO5054 |
500 MHz, 5 GS/s, 12.5M record length, 4+16 channel mixed signal oscilloscope |
|
MSO5104 |
1 GHz, 10/5 GS/s (2/4 ch), 12.5M record length, 4+16 channel mixed signal oscilloscope |
|
MSO5204 |
2 GHz, 10/5 GS/s (2/4 ch), 12.5M record length, 4+16 channel mixed signal oscilloscope |
All Models Include: One passive voltage probe per analog channel (TPP0500: 500 MHz, 10X, 3.9 pF for 500 MHz and 350 MHz models; TPP1000: 1 GHz, 10X, 3.9 pF for 2 GHz and 1 GHz models), front cover (200-5130-xx), touch-screen stylus (119-6107-xx), user manual (071-2790-xx), NI LabVIEW SignalExpress Tektronix Edition software, accessory pouch, mouse, Calibration Certificate documenting measurement traceability to National Metrology Institute(s), Z 540-1 Compliance and ISO9001, power cord, one-year warranty.
MSO Models also Include: P6616 16-channel logic probe and a logic probe accessory kit (020-2662-xx).
Note: Please specify power plug and manual language version when ordering.
Options
Record Length Options
|
Option |
MSO5034
DPO5034
MSO5054
DPO5054 |
MSO5104
DPO5104
MSO5204
DPO5204 |
|
Opt. 2RL |
25M/Ch |
50M max, 25M/Ch |
|
Opt. 5RL |
50M/Ch |
125M max, 50M/Ch |
|
Opt. 10RL |
125M/Ch |
250M max, 125M/Ch |
Software Options
|
Option |
Description |
|
Opt. DDRA*1 |
DDR Memory Bus Analysis |
|
Opt. DJA |
Jitter and Eye Analysis Tools – Advanced (DPOJET) |
|
Opt. ET3*2 |
Ethernet Compliance Testing |
|
Opt. LT |
Waveform Limit Testing |
|
Opt. MTM |
Mask Testing
– ITU-T (64 Kb/s to 155 Mb/s)
– ANSI T1.102 (1.544 Mb/s to 155 Mb/s)
– Ethernet IEEE 802.3, ANSI X3.263 (125 Mb/s to 1.25 Gb/s)
– Sonet/SDH (51.84 Mb/s to 622 Mb/s)
– Fibre Channel (133 Mb/s to 2.125 Gb/s)
– Fibre Channel Electrical (133 Mb/s to 1.06 Gb/s)
– USB (12 Mb/s to 480 Mb/s)
– IEEE 1394b (491.5 Mb/s to 1.966 Gb/s)
– Rapid I/O Serial (up to 1.25 Gb/s)
– Rapid I/O LP-LVDS (500 Mb/s to 1 Gb/s)
– OIF Standards (1.244 Gb/s)
– CPRI, V4.0 (1.228 Gb/s)
– Video (143.18 Mb/s to 360 Mb/s) |
|
Opt. PWR |
Power Measurement and Analysis |
|
Opt. SR-COMP |
Computer Serial Triggering and Analysis (RS-232/422/485/UART)
Enables triggering on packet-level information on RS-232/422/485/UART buses as well as analytical tools such as digital views of the signal, bus views, and packet decoding.
Signal Inputs – Any Ch1 - Ch4 (and any D0 - D15 on MSO models)
Recommended Probing – RS-232/UART: Single ended; RS-422/485: Differential |
|
Opt. SR-EMBD |
Embedded Serial Triggering and Analysis (I2C, SPI)
Enables triggering on packet-level information on I2C and SPI buses as well as analytical tools such as digital views of the signal, bus views, and packet decoding.
Signal Inputs – I2C: Any Ch1 - Ch4 (and any D0 - D15 on MSO models); SPI: Any Ch1 - Ch4 (and any D0 - D15 on MSO models)
Recommended Probing – I2C, SPI: Single ended |
|
Opt. SR-USB |
USB Serial Triggering and Analysis (LS, FS, HS)
Enables triggering on packet-level content for low-speed, full-speed, and high-speed USB serial buses. Also enables analytical tools such as digital views of the signal, bus views, and packet decoding for low-speed, full-speed, and high-speed USB serial buses.
Signal Inputs – Low-speed and Full-speed: Any Ch1 - Ch4 (and any D0 - D15 on MSO models) for single ended, Any Ch1 - Ch4 for differential; High-speed: Any Ch1 - Ch4
Recommended Probing – Low-speed and Full-speed: Single ended or differential; High-speed: Differential
USB high-speed supported only on MSO5204, DPO5204, MSO5104, and DPO5104 models. |
|
Opt. USB*3 |
USB 2.0 Compliance Testing |
|
Opt. VNM |
CAN/LIN Protocol Analysis Software |
|
Bundle Options |
|
Opt. PS1 |
Power Solution Bundle: DPOPWR, P5205, TCP0030, TPA-BNC, 067-1686-xx (Deskew Fixture) |
|
Floating licenses offer an alternative method to manage your Tektronix asset. Floating licenses allow license-key enabled options to be easily moved among all your MSO/DPO5000, DPO7000, and DPO/DSA/MSO70000 Series of Tektronix oscilloscopes. Floating licenses are available for many license-key enabled options. To order a floating version of an option license add “DPOFL-“ prefix to the option name. (e.g. DPOFL-ET3)
Check www.tek.com/products/oscilloscopes/floatinglicenses for additional information about floating license options. |
*1 Requires Opt. DJA. Available on 1 GHz and 2 GHz models only.
*2 Requires TF-GBE-BTP or TF-GBE-ATP Ethernet Test Fixture.
*3 Requires TDSUSBF (USB Test Fixture). 2 GHz bandwidth required for high-speed USB.
Power Plug Options
|
Option |
Description |
|
Opt. A0 |
North America |
|
Opt. A1 |
Universal European Union |
|
Opt. A2 |
UK |
|
Opt. A3 |
Australia |
|
Opt. A5 |
Switzerland |
|
Opt. A6 |
Japan |
|
Opt. A10 |
China |
|
Opt. A11 |
India |
|
Opt. A12 |
Brazil |
|
Opt. A99 |
No power cord |
User Manual Options
|
Option |
Description |
|
Opt. L0 |
English manual |
|
Opt. L1 |
French manual |
|
Opt. L3 |
German manual |
|
Opt. L5 |
Japanese manual |
|
Opt. L7 |
Simplified Chinese manual |
|
Opt. L8 |
Traditional Chinese manual |
|
Opt. L9 |
Korean manual |
|
Opt. L10 |
Russian manual |
Service Options*4
|
Option |
Description |
|
Opt. CA1 |
Provides a single calibration event, or coverage for the designated calibration interval, whichever comes first |
|
Opt. C3 |
Calibration Service 3 Years |
|
Opt. C5 |
Calibration Service 5 Years |
|
Opt. D1 |
Calibration Data Report |
|
Opt. D3 |
Calibration Data Report 3 Years (with Opt. C3) |
|
Opt. D5 |
Calibration Data Report 5 Years (with Opt. C5) |
|
Opt. G3 |
Complete Care 3 Years (includes loaner, scheduled calibration, and more) |
|
Opt. G5 |
Complete Care 5 Years (includes loaner, scheduled calibration, and more) |
|
Opt. R3 |
Repair Service 3 Years (including warranty) |
|
Opt. R5 |
Repair Service 5 Years (including warranty) |
*4 Probes and accessories are not included in the oscilloscope warranty. Refer to the data sheet for each probe for its unique warranty and calibration terms.
Recommended Accessories
Probes
|
Probe |
Description |
|
Tektronix offers over 100 different probes to meet your application needs. For a comprehensive listing of available probes, please visit www.tektronix.com/probes. |
|
TPP0500 |
500 MHz, 10X TekVPI® passive voltage probe with 3.9 pF input capacitance |
|
TPP1000 |
1 GHz, 10X TekVPI passive voltage probe with 3.9 pF input capacitance |
|
TAP2500 |
2.5 GHz TekVPI active single-ended voltage probe |
|
TAP1500 |
1.5 GHz TekVPI active single-ended voltage probe |
|
TDP3500 |
3.5 GHz TekVPI differential voltage probe with ±25 V differential input voltage |
|
TDP1500 |
1.5 GHz TekVPI differential voltage probe with ±25 V differential input voltage |
|
TDP1000 |
1 GHz TekVPI differential voltage probe with ±42 V differential input voltage |
|
TDP0500 |
500 MHz TekVPI differential voltage probe with ±42 V differential input voltage |
|
TCP0150 |
20 MHz TekVPI 150 Ampere AC/DC current probe |
|
TCP0030 |
120 MHz TekVPI 30 Ampere AC/DC current probe |
|
P5200 |
1.3 kV, 25 MHz high-voltage differential probe |
|
P5205*5 |
1.3 kV, 100 MHz high-voltage differential probe |
|
P5210*5 |
5.6 kV, 50 MHz high-voltage differential probe |
|
P5100 |
2.5 kV, 100X high-voltage passive probe |
*5 Requires TekVPI® to TekProbe BNC adapter (TPA-BNC).
Accessories
|
Accessory |
Description |
|
077-0076-xx |
Service Manual |
|
077-0010-10 |
Programmer Manual |
|
077-0063-05 |
Performance Verification and Specifications Manual |
|
SIGEXPTE |
NI LabVIEW SignalExpress Tektronix Edition Software (Full Version) |
|
TPA-BNC |
TekVPI-to-TekProbe BNC Adapter |
|
TEK-USB-488 |
GPIB-to-USB Adapter |
|
HCTEK54 |
Hard Transit Case |
|
RMD5000 |
Rackmount Kit |
|
119-7083-xx |
Mini Keyboard (USB interface) |
|
119-6297-xx |
Full-size keyboard with 4-port USB hub |
|
119-7766-xx |
External DVD R/W Drive |
|
065-0851-xx |
Removable HD Spare with rotational media |
|
K420 |
Oscilloscope Cart |
Cables
|
Cable |
Description |
|
012-0991-xx |
GPIB Cable (1 m) |
|
012-0991-xx |
GPIB Cable (2 m) |
Test Fixtures
|
Fixture |
Description |
|
TDSUSBF |
Test fixture for use with Opt. USB |
|
TF-GBE-BTP |
Basic test package for 10/100/1000BASE-T Ethernet tests |
|
TF-GBE-ATP |
Advanced test package for 10/100/1000BASE-T Ethernet (includes 1000BASE-T jitter test channel cable) |
|
TF-GBE-EE |
Additional test fixture for Energy Efficient Ethernet measurements |
|
Ethernet Test Fixture |
Order through Crescent Heart Software (http://www.c-h-s.com) |
Adapters
|
Adapter |
Description |
|
P6701B*4 |
Optical/Electrical Converter (Multi Mode) |
|
P6703B*4 |
Optical/Electrical Converter (Single Mode) |
*4 Probes and accessories are not included in the oscilloscope warranty. Refer to the data sheet for each probe for its unique warranty and calibration terms.
Instrument Upgrades
|
Option |
Description |
|
Floating licenses offer an alternative method to manage your Tektronix asset. Floating licenses allow license-key enabled options to be easily moved among all your MSO/DPO5000, DPO7000, and DPO/DSA/MSO70000 Series of Tektronix oscilloscopes. Floating licenses are available for many license-key enabled options. To order a floating version of an option license add “DPOFL-“ prefix to the option name. (e.g. DPOFL-ET3)
Check www.tek.com/products/oscilloscopes/floatinglicenses for additional information about floating license options.
To upgrade your MSO/DPO5000 Series oscilloscope, order DPO-UP and option listed below. For example, DPO-UP DDRA. |
|
To upgrade record length: |
|
RL02E |
From Standard Configuration to Opt. 2RL Configuration |
|
RL05E |
From Standard Configuration to Opt. 5RL Configuration , |
|
RL010E |
From Standard Configuration to Opt. 10RL Configuration |
|
RL25E |
From Opt. 2RL Configuration to Opt. 5RL Configuration |
|
RL210E |
From Opt. 2RL Configuration to Opt. 10RL Configuration |
|
RL510E |
From Opt. 5RL Configuration to Opt. 10RL Configuration |
|
To upgrade MSO/DPO5000 Series with: |
|
DDRA*1 |
Add Opt. DDRA |
|
DJAE |
Add Opt. DJA – Jitter and Eye Analysis Tools - Advanced (DPOJET) |
|
ET3*2 |
Add Opt. ET3 – Ethernet Compliance Testing |
|
LT |
Add Opt. LT – Waveform Limit Testing |
|
MTM |
Add Opt. MTM – Mask Testing |
|
PWR |
Add Opt. PWR – Power Measurement and Analysis |
|
SR-COMP |
Add Opt. SR-COMP – Computer Serial Triggering and Analysis (RS-232/422/485/UART) |
|
SR-EMBD |
Add Opt. SR-EMBD – Embedded Serial Triggering and Analysis (I2C, SPI) |
|
SR-USB |
Add Opt. SR-USB – USB Serial Triggering and Analysis (LS, FS, HS) |
|
USB*3 |
Add Opt. USB – USB Compliance Testing |
|
VNM |
Add Opt. VNM – CAN/LIN Serial Protocol Decode |
|
To upgrade DPO5000 Series with: |
|
MSOE |
Add 16-digital channels to a DPO5000 |
*1 Requires Opt. DJA. Available on 1 GHz and 2 GHz models only.
*2 Requires TF-GBE-BTP or TF-GBE-ATP Ethernet Test Fixture.
*3 Requires TDSUSBF (USB Test Fixture). 2 GHz bandwidth required for high-speed USB. |
|
|
|
|
|
|